Open Source: Smooth Polar Chart in Flutter using a Catmull-Rom spline interpolation
A polar plot is a type of graph that uses polar coordinates to represent data points. Instead of using Cartesian coordinates (x, y), which represent data points along a horizontal and vertical axis, polar plots utilize the radius and angle of a point to plot it on a two-dimensional plane.
GitHub: https://github.com/indigothm/smooth_polar_chart_flutter
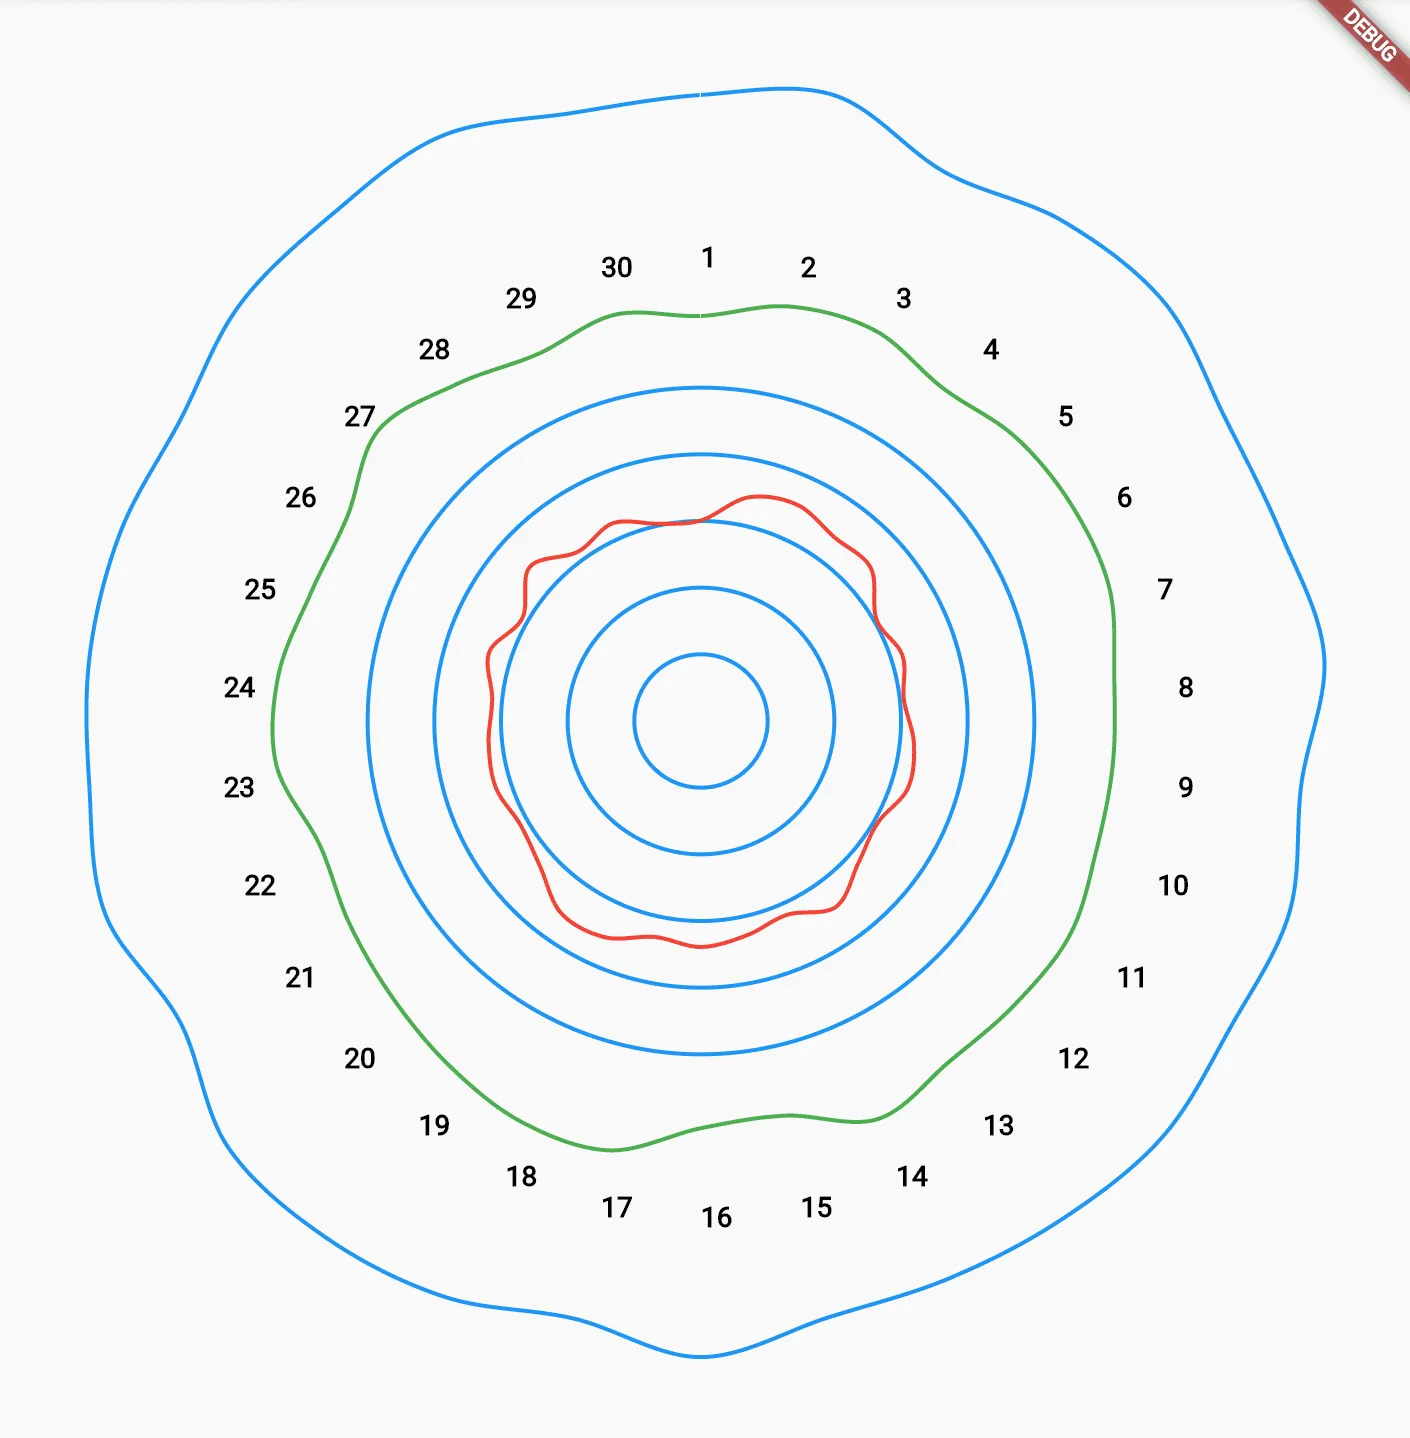
This prototype can be used to create data visualizations like the one below:

About me

Elliot Tikhomirov
Specialising in mobile development for over 8 years, I craft exceptional digital experiences through technical expertise and a commitment to design excellence. My deep proficiency in Flutter, Swift and React Native enables me to deliver high-performance applications that serve millions across health tech, government and fitness industries.
Learn More